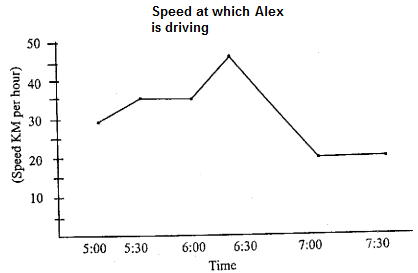
1) How far, in km, did Alex drive between 5:30 and 6:00?
(A) 20
(B) 17 1/2
(C) 35
(D) 12 1/2
2) What was Alex's average speed, in km per hour between 5:30 to 6:30?
(A) 25.25
(B) 35.5
(C) 42.5
(D) 36.25
3) For what percent of time Alex driving at 35 Km per hour or faster?
(A) 35
(B) 25
(C) 27
(D) 50