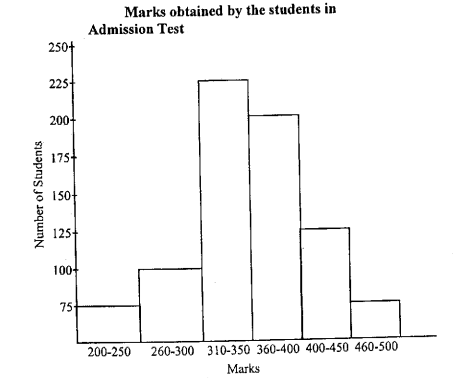
1) How many candidates gave the admission test?
(A) 400
(B) 375
(C) 600
(D) 800
2) What percent of the candidates had scored less than 400?
(A) 50
(B) 75
(C) 25
(D) 65
3) How many candidates scored between 250 to 350?
(A) 325
(B) 225
(C) 125
(D) Cannot be exactly determined from the given information